Indian residential market records 9 year-high sales volume of 158,705 housing units in H1 2022: Knight Frank India
- NCR witnesses 154% YoY rise in home sales during H1 2022
- Significant fall in Quarters to sell (QTS) of unsold inventory from 10.9 quarters in H1 2021 to 7.8 quarters in H1 2022
Office transactions recorded at 25.3 mnsqft; translating into a massive 107% YoY growth during H1 2022: Knight Frank India
- Bengaluru (7.7 mnsq ft) and NCR (4.1 mnsq ft) lead in transaction volume
- Co-working/managed office sector witnessed maximum increase in share of total transactions from 10% in H1 2021 to 17% in H1 2022
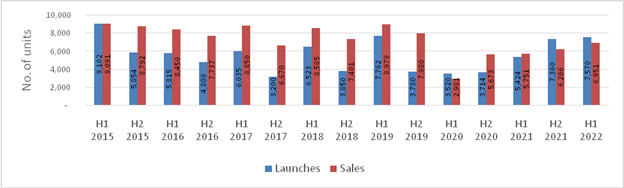
Mumbai, July 06, 2022: In their latest report, Knight Frank India noted that the residential sector has recorded a 9-year high in the sales volume in H1 2022 (January – June 2022). The residential sector saw an annual growth of 60% in H1 2022 to 158,705 housing units across top eight cities in the country from 99,416 in H1 2021.The pr evious high was recorded in H1 2013 of 185,577 units. At an 8-year high for any half-year period, new home unit launches witnessed an addition of 160,806 units in H1 2022marking arise of 56%Year on Year (YoY) fro m10 3,238 units in H1 2021.The strong uptick in sales also brought the Quarters to sell (QTS) level down to 7.8 qua rters from 10.9 quarters in H1 2021.
Mumbai (44,200), National Capital Region (29,101) and Bengaluru (26,677) were the leading residential sales performers in H1 2022.NCR and Ahmedabad witnessed the highest home sales (in terms of percentage growth) during H2 2021 at 154% and 95% YoY respectively. According to the report, residential prices recorded a strong growth across all cities during the first half of the year. The share of sales in the INR 10 mn and above ticket-size grew significantly from 20% in H1 2021 to 25% in H1 2022.
For the Commercial office segment, the India office market grew substantially and delivered a strong perform ance in H1 2022. Office transactions recorded at 25.3 million square feet (mnsq ft)grew by107% YoY, indicating the potential of the market on the back of a waning pandemic and the promise of a sustained economic recovery. Bengaluru led with 7.7 mnsq ftfollowed by NCR with 4.1 mnsq ft of office transactions during H1 2022. New com pletion volumes,which have been the highest since the start of the pandemic,were recorded at 24.1 mnsq ft, hig her by 61% over H1 2021.

On the office market performance, Knight Frank India cited that all the top eight cities witnessed substantial gro wth during H1 2022, recording transactions of 25.3 mnsq ft in Jan – June 2022, whereas the office complet ions were recorded at 24.1 mnsq ft in the same period. Bengaluru constituted 31% of the total area transacted with the highest rental increase of 13% YoY in H1 2022. With the increasing need for flexibility and a hybrid working environment, co-working/managed office sector’s transactions share increased to 17% in H1 2022 from 10% in H1 2021.
Knight Frank India today launched the 17th edition of its flagship half-yearly report – India Real Estate: Resident ial and Office Market H1 2022 – which presents a comprehensive analysis of the residential and office market performance across eight major cities[1]for the January – June2022 period. As per the report latest report, India Real Estate: H1 2022
ALL INDIA RESIDENTIAL UPDATE: H1 2022 (JANUARY – JUNE 2022)
With sales of 158,705 units,H1 2022 posted the highest sales volume since H2 2013 for any half yearly period.S ales registered a growth of 60% YoY in H1 2022. The robust volume in sales has significantly increased real estat e prices across all markets homebuyers’ need to upgrade primary lifestyle, low interest rates and comparatively low home prices to the pre-pandemic levels along with the renewed need for home ownership sparked by the pa ndemic, have been the primary drivers for this growth. Developers strategically responded to the demand mom entum and the shift in sentiment and launched 160,806 units in H1 2022, which was 56% higher than H1 2021.
Strong growth in sales velocity, has led to a modest decline in unsold inventory which level dipped marginally to 440,117 units in H1 2022.The strong uptick in sales also brought the Quarters to sell (QTS) level down to 7.8 quarters from 10.9 quarters in H1 2021.
RESIDENTIAL MARKET SUMMARY: TOP EIGHT INDIAN CITIES
| Sales | Launches | |||||
| City | H1 2021 | H1 2022 | % Change (YoY) | H1 2021 | H1 2022 | % Change (YoY) |
| Mumbai | 28,607 | 44,200 | 55% | 35,872 | 47,466 | 32% |
| NCR | 11,474 | 29,101 | 154% | 2,943 | 28,726 | 876% |
| Bengaluru | 14,812 | 26,677 | 80% | 13,389 | 21,223 | 59% |
| Pune | 17,474 | 21,797 | 25% | 20,477 | 17,393 | -15% |
| Chennai | 5,751 | 6,951 | 21% | 5,424 | 7,570 | 40% |
| Hyderabad | 11,974 | 14,693 | 23% | 16,712 | 21,356 | 28% |
| Kolkata | 5,115 | 7,090 | 39% | 2,195 | 6,686 | 205% |
| Ahmedabad | 4,208 | 8,197 | 95% | 6,226 | 10,385 | 67% |
| All India | 99,415 | 158,705 | 60% | 80,566 | 160,806 | 56% |
Source: Knight Frank India
Mumbai, National Capital Region (NCR) and Bengaluru dominated the home sales activity
Mumbai’s sales volume of 44,200 home units accounted for 28% of the total sales amongst the top 8 markets, highest among all markets. In terms of annual percentage increment, NCR witnessed an increase of 154% YoY with sales volume of 29,101 units. Besidesbeing the biggest mover, NCR accorded for the second largest share of sales amongst the eight markets of the country.Bengaluru had a similar strong performance with sales growth of 80% YoY in H1 2022 to 26,667 units as increased hiring and steady income growth in the Information Techno log y (IT) sector dominated market, also buoyed homebuyer demand.
The share of sales of homes costing INR 10 mn(INR 1 Crore) and above grew to make up 25% sales in H1 2022 co mpared to 20% a year ago. This can be attributed to the homebuyers’ need to upgrade to larger living spaces wit h better amenities, and to the fact that pandemic-induced income disruptions did not impact higher income cate gories as they did for the others. On the contrary, the share of home in the INR 5-10 mn(INR 50 lakhs – INR 1 Cr ore) category dropped to 34% in H1 2022 as against 39% in H1 2021. The INR 5 mn(INR 50 lakhs) and below cat egory declined marginally from 42% in H1 2021 to 40%.
TICKET SIZE SPLIT COMPARISON OF SALES DURING H1 2021 AND H1 2022
Source: Knight Frank India
Pricesincreased across all markets in the range of 3% – 9% YoY with some of the larger volume markets of Mum bai (6%), Bengaluru (9%) and NCR (7%) registering notable growths. This also marks H1 2022 as a period in whi ch prices have grown in YoY terms across all markets for the first time since H2 2015.
RESIDENTIAL PRICE MOVEMENT
| City | Average Price (INR/ sq ft) | 12 month change | 6 month change |
| Mumbai | 7,163 | 6% | 4% |
| NCR | 4,437 | 7% | 6% |
| Bengaluru | 5,358 | 9% | 4% |
| Pune | 4,242 | 6% | 6% |
| Chennai | 4,242 | 5% | 5% |
| Hyderabad | 4,918 | 4% | 4% |
| Kolkata | 3,345 | 4% | 4% |
| Ahmedabad | 2,880 | 3% | 3% |
Source: Knight Frank India
Shishir Baijal, Chairman and Managing Director, Knight Frank India said, “Home buying has witnessed a strong rebo und since the advent of the pandemic and continues despite inflationary concerns in the economy. The interest rate cycle having turned during this period which has impacted affordability, but the performance of the broader economy (and ch anged buyer perceptions) has had a greater bearing on market momentum for the remainder of the year as it dictates homebuyer income levels and demand much more directly.”

ALL INDIA OFFICE UPDATE: H1 2022 (JANUARY – JUNE 2022)
The office market saw robust activities during H1 2022 on the back of the waning pandemic and sustained econo mic recovery despite geo-political pressures. A total of 25.3 mnsq ft of office space was transacted during H1 20 22 compared to 12.3 mnsq ft in H1 2021, growing by 107% YOY.In the first half of the year, Q2 2022 registered 14.6 mnsq ft of gross leasing as compared to Q1 2022 where leasing was recorded at 10.7 mnsq ft. A marginal slowdown in leasing activities witnessed in the early part of the year due to socio -economic and geo – political standoff was quickly overcome.
INDIAN OFFICE MARKET ACTIVITY
Source: Knight Frank India
New completions also picked up significantly with 24.1 mnsq ft getting delivered in H1 2022, a 61% growth YoY. Bengaluru, with 5.8 mnsq ft along with Hyderabad with 5.3 mnsq ftcumulatively constituted 46% of the total sp ace delivered during the period.
MARKET SUMMARY: TOP EIGHT INDIAN CITIES
| Office Transactions | New Completions | |||||
| City | H1 2021MN SQ FT | H1 2022 MN SQ F | % Change (YoY) | H1 2021IN MN SQ FT | H1 2022 IN MN SQ FT | % Change (YoY) |
| Mumbai | 1.6 | 3.0 | 81% | 1.3 | 1.0 | -21% |
| NCR | 2.4 | 4.1 | 69% | 3.0 | 2.5 | -17% |
| Bengaluru | 3.6 | 7.7 | 117% | 5.2 | 5.8 | 12% |
| Pune | 1.15 | 3.3 | 187% | 2.89 | 5.0 | 73% |
| Ahmedabad | 0.42 | 1.3 | 201% | 1.1 | 1.3 | 22% |
| Chennai | 1.2 | 2.2 | 80% | 0.8 | 3.0 | 272% |
| Hyderabad | 1.60 | 3.2 | 101% | 0.8 | 5.3 | 603% |
| Kolkata | 0.3 | 0.6 | 128% | – | 0.2 | – |
| All India | 12.3 | 25.3 | 107% | 15.0 | 24.1 | 61% |
Source: Knight Frank India
From the aspect of office rents,Bengaluru and Pune office markets recorded maximum increase in their rental value at 13% and 8% YoY respectively mostly due to higher demand and lack of Grade A space. Hyderabad, Mu mbai and NCR also witnessed moderate increase in their rental values whereas the rental values in Chennai, Ahmedabad and Kolkata remained stable.
MARKET WISE RENTAL MOVEMENT
| City | Average Rental values INR/ sq ft | 12 month change | 6 month change |
| Mumbai | 110 | 1% | 3% |
| NCR | 81.5 | 1% | -1% |
| Bengaluru | 81 | 13% | 11% |
| Pune | 71 | 8% | 6% |
| Ahmedabad | 40.2 | 0% | 0% |
| Chennai | 59.9 | 0% | 3% |
| Hyderabad | 63.7 | 3% | 4% |
| Kolkata | 34.7 | 0% | 0% |
Source: Knight Frank India
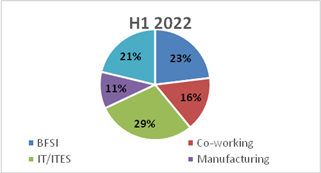
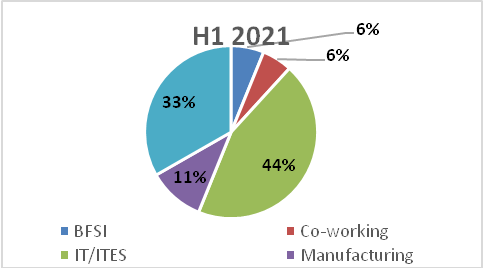
From sector wise transaction split in H1 2022, Information Technology remained the single largest occupier of office space with 27% during H1 2022. The share of the co-working sector in total transactions increased to 17% in H1 2022 from 10% in H1 2021 recording the maximum increase across all sectors. The occupiers’ preference for flexibility and the overall service offering of a co-working/managed office premise has taken root during the pandemic and is expected to stabilize, going forward.Other sectors which include,healthcare, logistics, media, legal, consulting etc. constituted 32% of all leasing activities.
SECTOR WISE TRANSACTION SPLIT (H1 2021 and H1 2022)
Note: BFSI includes BFSI support services
Source: Knight Frank Research
Note: BFSI includes BFSI support services
Source: Knight Frank Research
Shishir Baijal, Chairman and Managing Director, Knight Frank India said, “The robust performance delivered by the office market during H1 2022 has set the tone for 2022. Physical occupancy levels are rising as more companies want their employees to return to office. At the same time, hiring across many sectors has picked up as India’s economic growt h continues. With the current pace of leasing, we expect the year of 2022 to see leasing volumes close to the peak of 201 9 and exceed in the next year. The focus amongst occupiers for this year will remain on flexibility, in leasing terms to allo w real time expansion and contractions indicating towards a strong year for managed office spaces.”
About Knight Frank
Knight Frank LLP is a leading independent, global property consultancy. Headquartered in London, Knight Frank has more than 16,000 people operating from over 384 offices across 51 markets. The Group advises clients ranging from individual owners and buyers to major developers, investors and corporate tenants. For further information about the Company, please visit www.knightfrank.com.
Knight Frank India is headquartered in Mumbai and has more than 1,400 experts across Bangalore, Delhi, Pune, Hydera bad, Chennai, Kolkata and Ahmedabad. Backed by strong research and analytics, our experts offer a comprehensive ra nge of real estate services across advisory, valuation and consulting, transactions (residential, commercial, retail, hospit ality, land & capitals), facilities management and project management. For more information, visit www.knightfran k.co .in
[1]Mumbai, National Capital Region (NCR), Bengaluru, Chennai, Hyderabad, Pune, Kolkata and Ahmedabad