Chennai records 21% YoY rise with sale of 6,951 residential units in H1 2022: Knight Frank India
- Micro markets of South and West Chennai accounted for 94% of the total sales
- 23% of sales in homes costing 10 mn in H1 2022
Chennai’s Office transaction volume rise 80% YoY; recorded at 2.2 mnsq ft in H1 2022: Knight Frank India
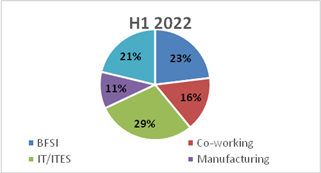
- IT sectoraccounts for 29% of the total area transacted during H1 2022; BFSI at 23%
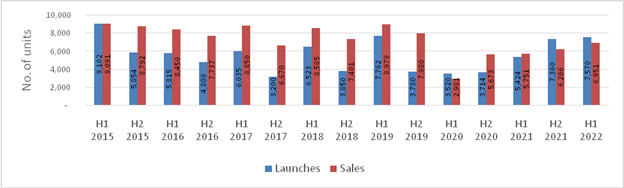
Mumbai, July 06, 2022: Knight Frank India in its latest report, India Real Estate: H1 2022 (January – June 2022) cited that the Chennai residential market registered a 21% Year on Year (YoY)growth in sales in H1 2022.The cit y recorded sales of 6,951 housing units in H1 2022 compared to 5,751 housing units sold in H1 2021.The new ho me launches also increased by 40% YoY from 5,424 housing units in H1 2021 to 7,570 housing units in H1 2022. The weighted average price of residential properties in Chennai rose by an estimated 5% YoY to INR 4,242 per sq ft. With increased launches, the Quarters to sell (QTS) has marginally increased from 4.2 quarters in H1 2021 to 4.4 quarters in H1 2022.
In H1 2022, office transaction volumesincreased by 80% YoY to be recorded at 2.2 mnsq ft. Newoffice completi ons recorded a growth of 272% YoY with 3.0 mnsq ft of new spaces completed during the same period.IT remai ned the most active sector which claimed 29% of the transacted space. This was followed by BFSI which saw a rise in its share to 23% in H1 2022 from its previous 6% in H1 2021. Rental values have remained stablewith no change on a YoY basis in H1 2022. Suburban Business District (SBD) continued to lead the market with 43% sh are of total space transacted during the period.

RESIDENTIAL MARKET UPDATE: H1 2022 (JANUARY – JUNE 2022)
With improved consumer sentiment,the city observed a continuous rise in the number of homebuyer inquiries and conversions in recent period. Homebuyers have become increasingly amenable to explore properties in new locations, for larger spaces with better amenities in order to improve the general quality of life. As a result of th at, sales (23%) as well as new launches (40%) saw a noteworthy rise. The share of sales for units above INR 10mn (INR 1 Crore) category witnessed the a yoy increase 8 percentage points to constitute 23% of all home sales in H1 2022. On the contrary, there has been a notable decline in the share of sales for homes below INR 5 mn(INR 50 Lakhs) to 31% in H1 2022from 54% in H1 2021.
South Chennai dominated the sales with 58% of the total sales recorded during H1 2022. The south micro-mar ket locations along the OMR and GST Road have continued to garner homebuyer interest, followed by the affordable locations in West Chennai such as Porur, Valasaravakkam and Poonamalle.
Residential demand was largely focused on the ready-to-move-in or near ready properties which has caused the average age of inventory in Chennai to reduce to 12.6 quarters in H1 2022from 16.5 quarters in the year ago period. The unsold inventory and QTS have increased marginally in YoY terms as launches exceeded demand during H12022.
CHENNAI RESIDENTIAL MARKET SUMMARY
| Parameter | 2021 | 2021 Change (YoY) | H1 2022 | H1 2022 Change (YoY) |
| Launches (housing units) | 12,783 | 77% | 7,570 | 40% |
| Sales (housing units) | 11,958 | 38.% | 6,951 | 21% |
| Average Price in INR/ sq ft | INR 4,050 | 6.7% | INR 4,242 | 4.7% |
Source: Knight Frank Research
Launches and sales trend
Source: Knight Frank Research
Srinivas Anikipatti, Senior Director- Tamil Nadu & Kerala at Knight Frank India, “Chennai residential market has been a balancing act between price and demand. While being a price sensitive market, with broadly stable values, sales volumes were maintained in the last 24 months. However, prices saw a notable decline post the onset of the pandemic, which triggered a growth in sales of residential markets. As the markets turn upwards, we also see a rise in prices as a co mbined effect of robust demand as well as rising input costs. Going forward, while we are sure that there is latent dem and, the values have to remain within the acceptable threshold for the demand to remain continuous.”
OFFICEMARKET UPDATE: H1 2022 (JANUARY – JUNE 2022)
CHENNAI OFFICE MARKET SUMMARY
| Parameter | 2021 | 2021 Change (YoY) | H1 2022 | H1 2022 Change (YoY) |
| Completions in mnsq ft | 1.8 | -47% | 3.0 | 272% |
| Transactions in mnsq ft | 3.9 | -14% | 2.2 | 80% |
| Average transacted rent in INR/sq ft/month | 58.3 | -2.7% | 59.9 | 0.0% |
Source: Knight Frank Research
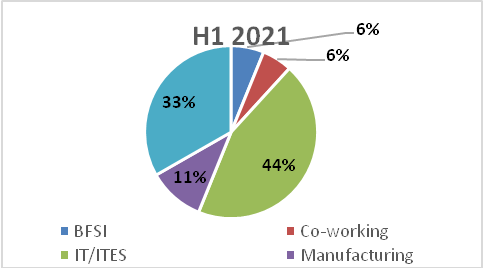
IT sector led with 29% share followed by BFSI sector with 23% of all transactions in H1 2022. The increasing ne ed for flexibility has boosted demand for co-working/managed office spaces in H1 2022 which registered 0.30 mnsq ft of office space transaction in H1 2022, the highest since H1 2019.The share of BFSI sector in total piei ncreased to 23% from 6% in H1 2022 recording the maximum increase across all sectors.

The SBD accounted for 43% of the total share of space transacted in Chennai followed by CBD with 25% in H1 2022. CBD and SBD OMR districts witnessed maximum increase in share of total space transacted. CBD’s share of space increased from 12% in H1 2021 to 20% in H1 2022 whereas SBD OMR’s share of space increased from 18% in H1 2021 to 25% in H1 2022.
In the first half of 2022, Chennai’s vacancy rate was 14%, which is comparable to other significant markets like Bengaluru and Hyderabad
Srinivas Anikipatti, Senior Director- Tamil Nadu & Kerala at Knight Frank India, “Despite the impact of third wave of the pandemic in early 2022, Chennai’s commercial market remained strong, as offices reopened, resulting in increased transaction activity.We expect the city to see a continued rise in the office market, given its inherent advantage of cost as well as high quality of office space.”
Sector-wise transactions split in H1 2021 and H1 2022
Note: BFSI includes BFSI support services
Source: Knight Frank Research
About Knight Frank
Knight Frank LLP is a leading independent, global property consultancy. Headquartered in London, Knight Frank has mo re than 20,000 people operating from over 488 offices across 57 markets. The Group advises clients ranging from indivi dual owners and buyers to major developers, investors and corporate tenants. For further information about the Comp any, please visit www.knightfrank.com.
Knight Frank India is headquartered in Mumbai and has more than 1,200 experts across Bangalore, Delhi, Pune, Hydera bad, Chennai, Kolkata and Ahmedabad. Backed by strong research and analytics, our experts offer a comprehensive ran ge of real estate services across advisory, valuation and consulting, transactions (residential, commercial, retail, hospita lity, land & capitals), facilities management and project management. For more information, visit www.knightfrank.co.in